Running a pipeline
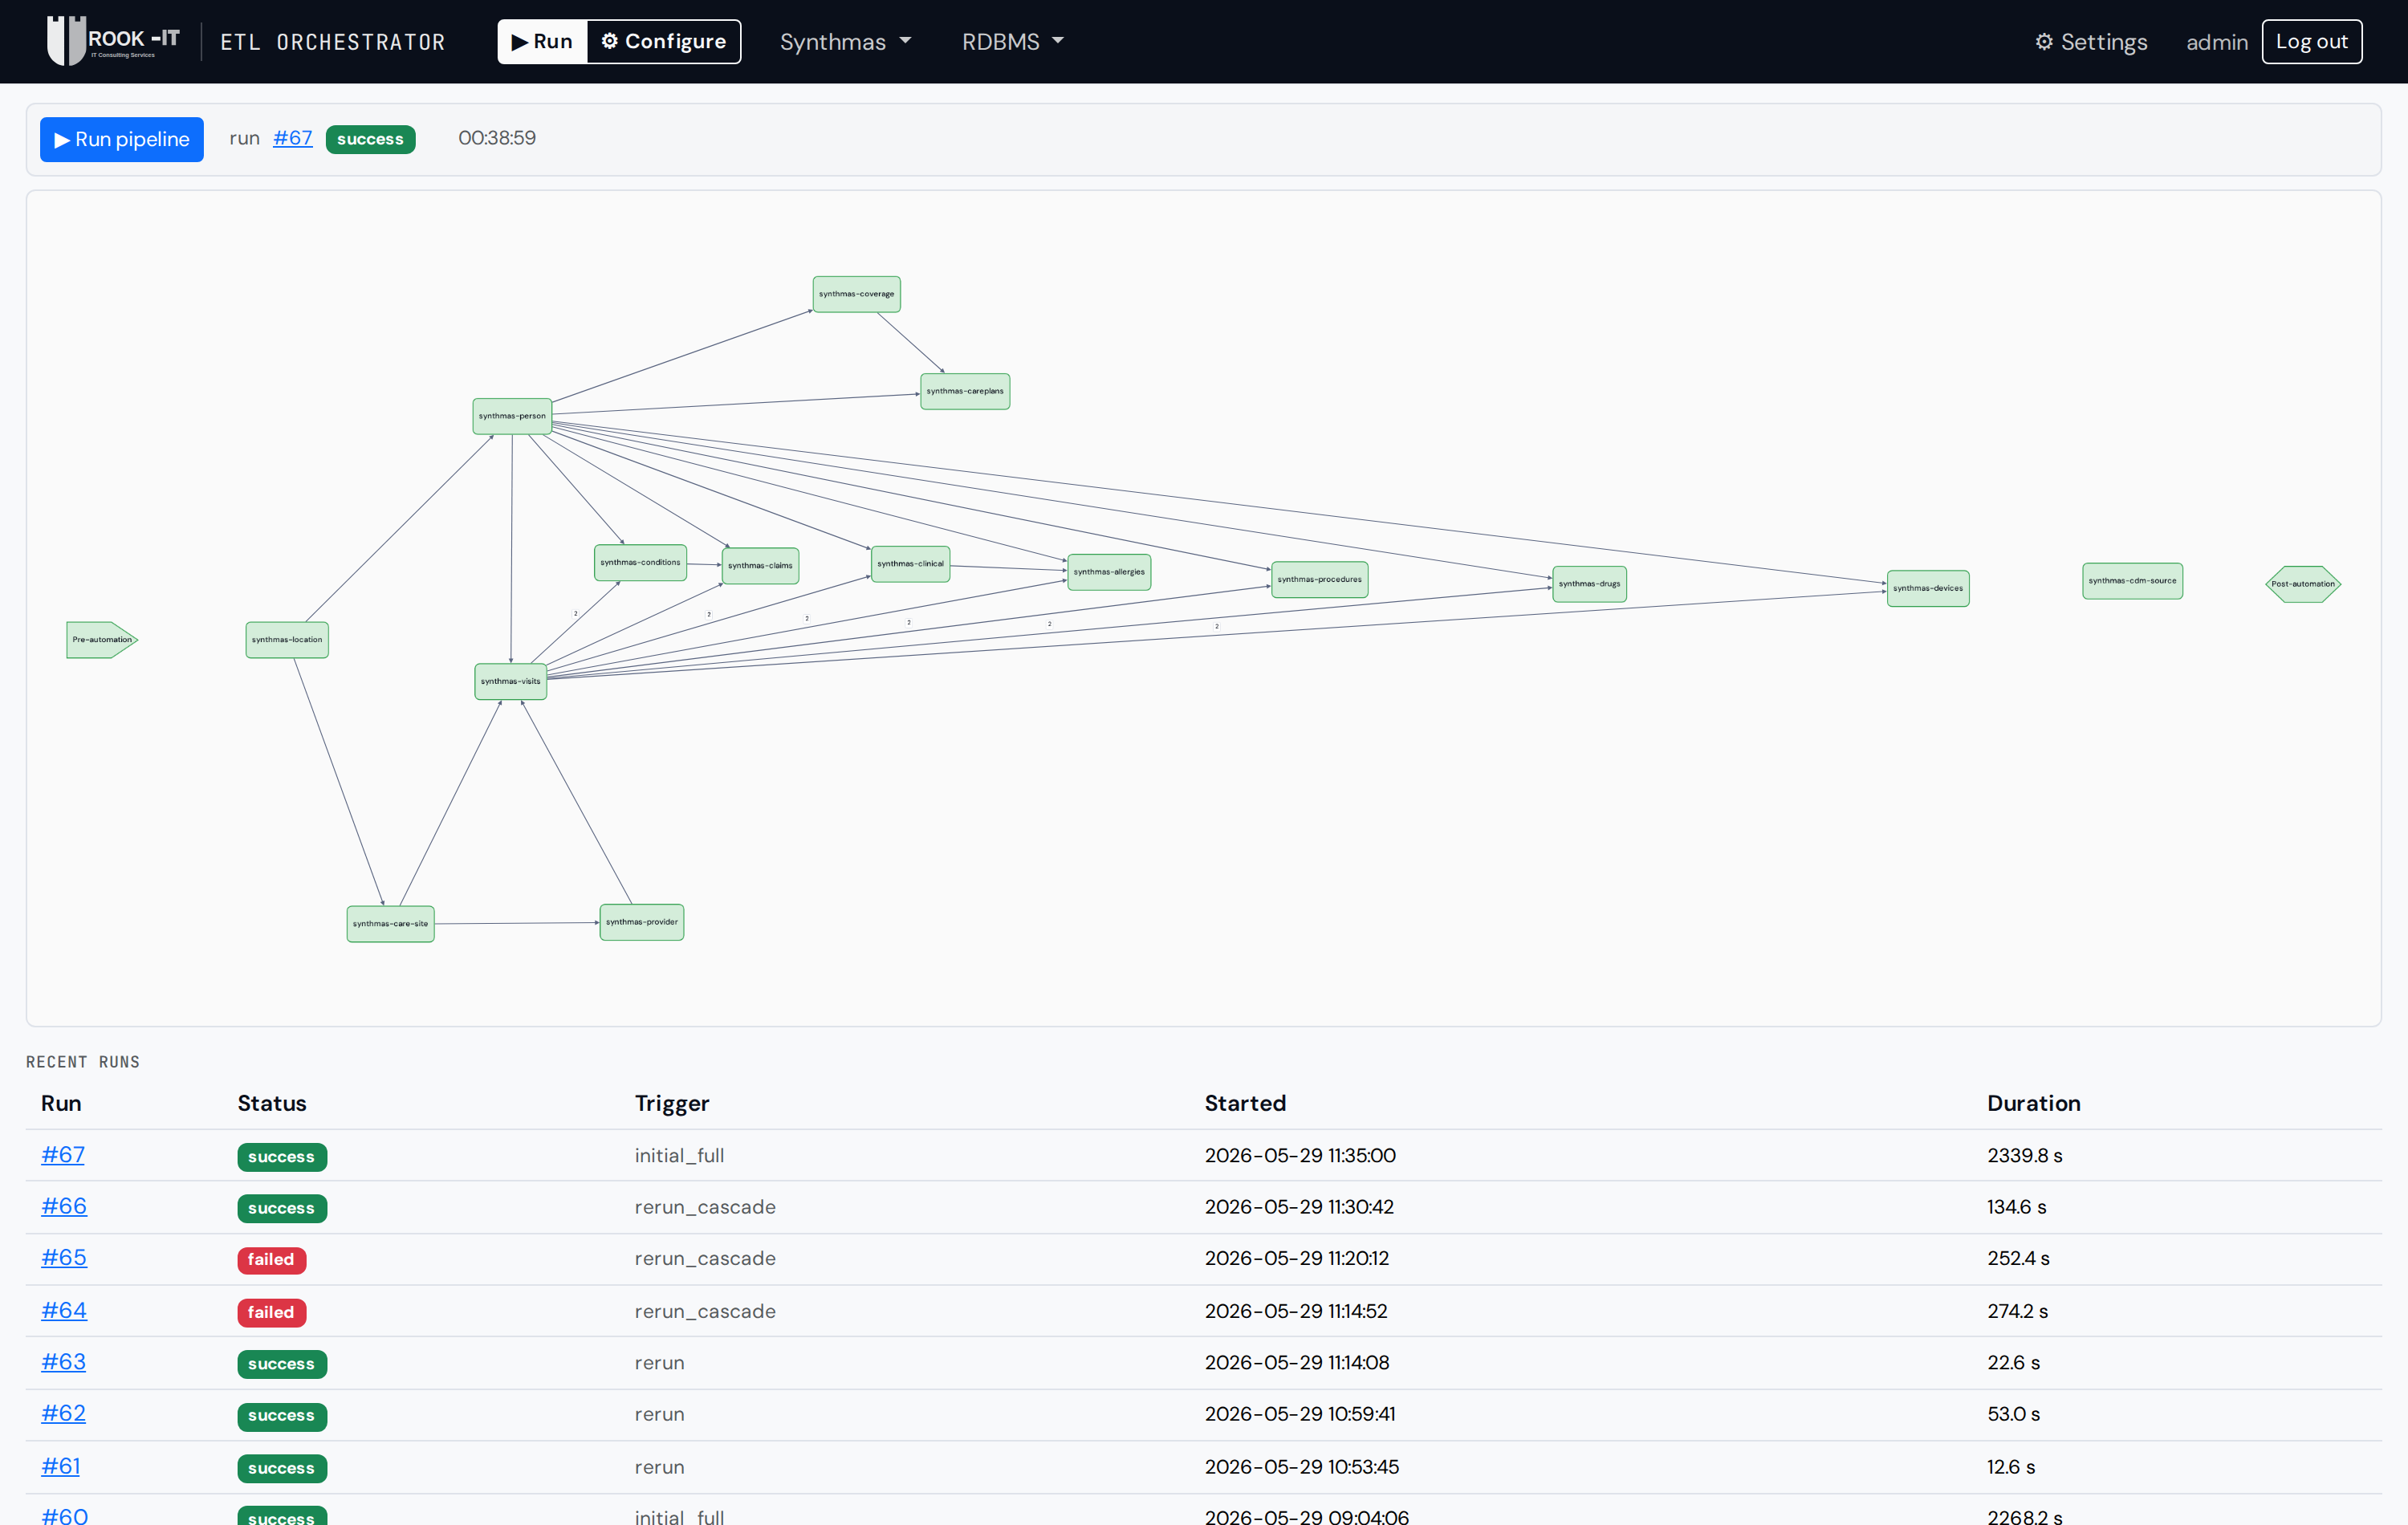
Pipelines run at the env level. Pick an environment, switch to Run mode, hit ▶ Run pipeline.
Modes
The environment page has a Configure / Run toggle in the top bar:
- Configure — the DAG with config affordances (upload RiaH, edit env, etc.). Greyed out when there's a run in flight to discourage changes mid-run.
- Run — the DAG with progress overlays: per-step bars beneath running nodes, status colors for each node, the ribbon bar at the top with overall progress, the auto-updating Recent Runs table.
Triggering a run
| Action | Where | What it does |
|---|---|---|
| ▶ Run pipeline | Run mode, top of page | New pipeline_run, full re-run (every step in topo order). |
| ↻ Rerun (cascade) | Right-click any etl_map node | Recompute the cascade (this step + every shared-table writer, transitively), TRUNCATE/wipe the affected tables, re-run only the cascade members. |
| ↻ Re-run this step | Right-click post-automation | Single-step re-run of just post-automation (observation_period + eras + preceding-visit-IDs). |
You can only have one run in flight at a time per env. Trying to start a second one shows a clear "a run is already running" error and links to the in-flight run's detail page.
Live progress
Three signals while a run is in flight:
- Ribbon bar (top) — overall % progress, weighted by row-count estimates per etl_map step + a synthetic budget for pre/post-auto.
- Per-step mini-bars — beneath each running DAG node. Click any node to open the full modal.
- Step modal — per-table progress for etl_map steps; for pre-automation: vocab table loaded counts + an "Indexes X of 17" bar; for post-automation: era counts as each task completes.
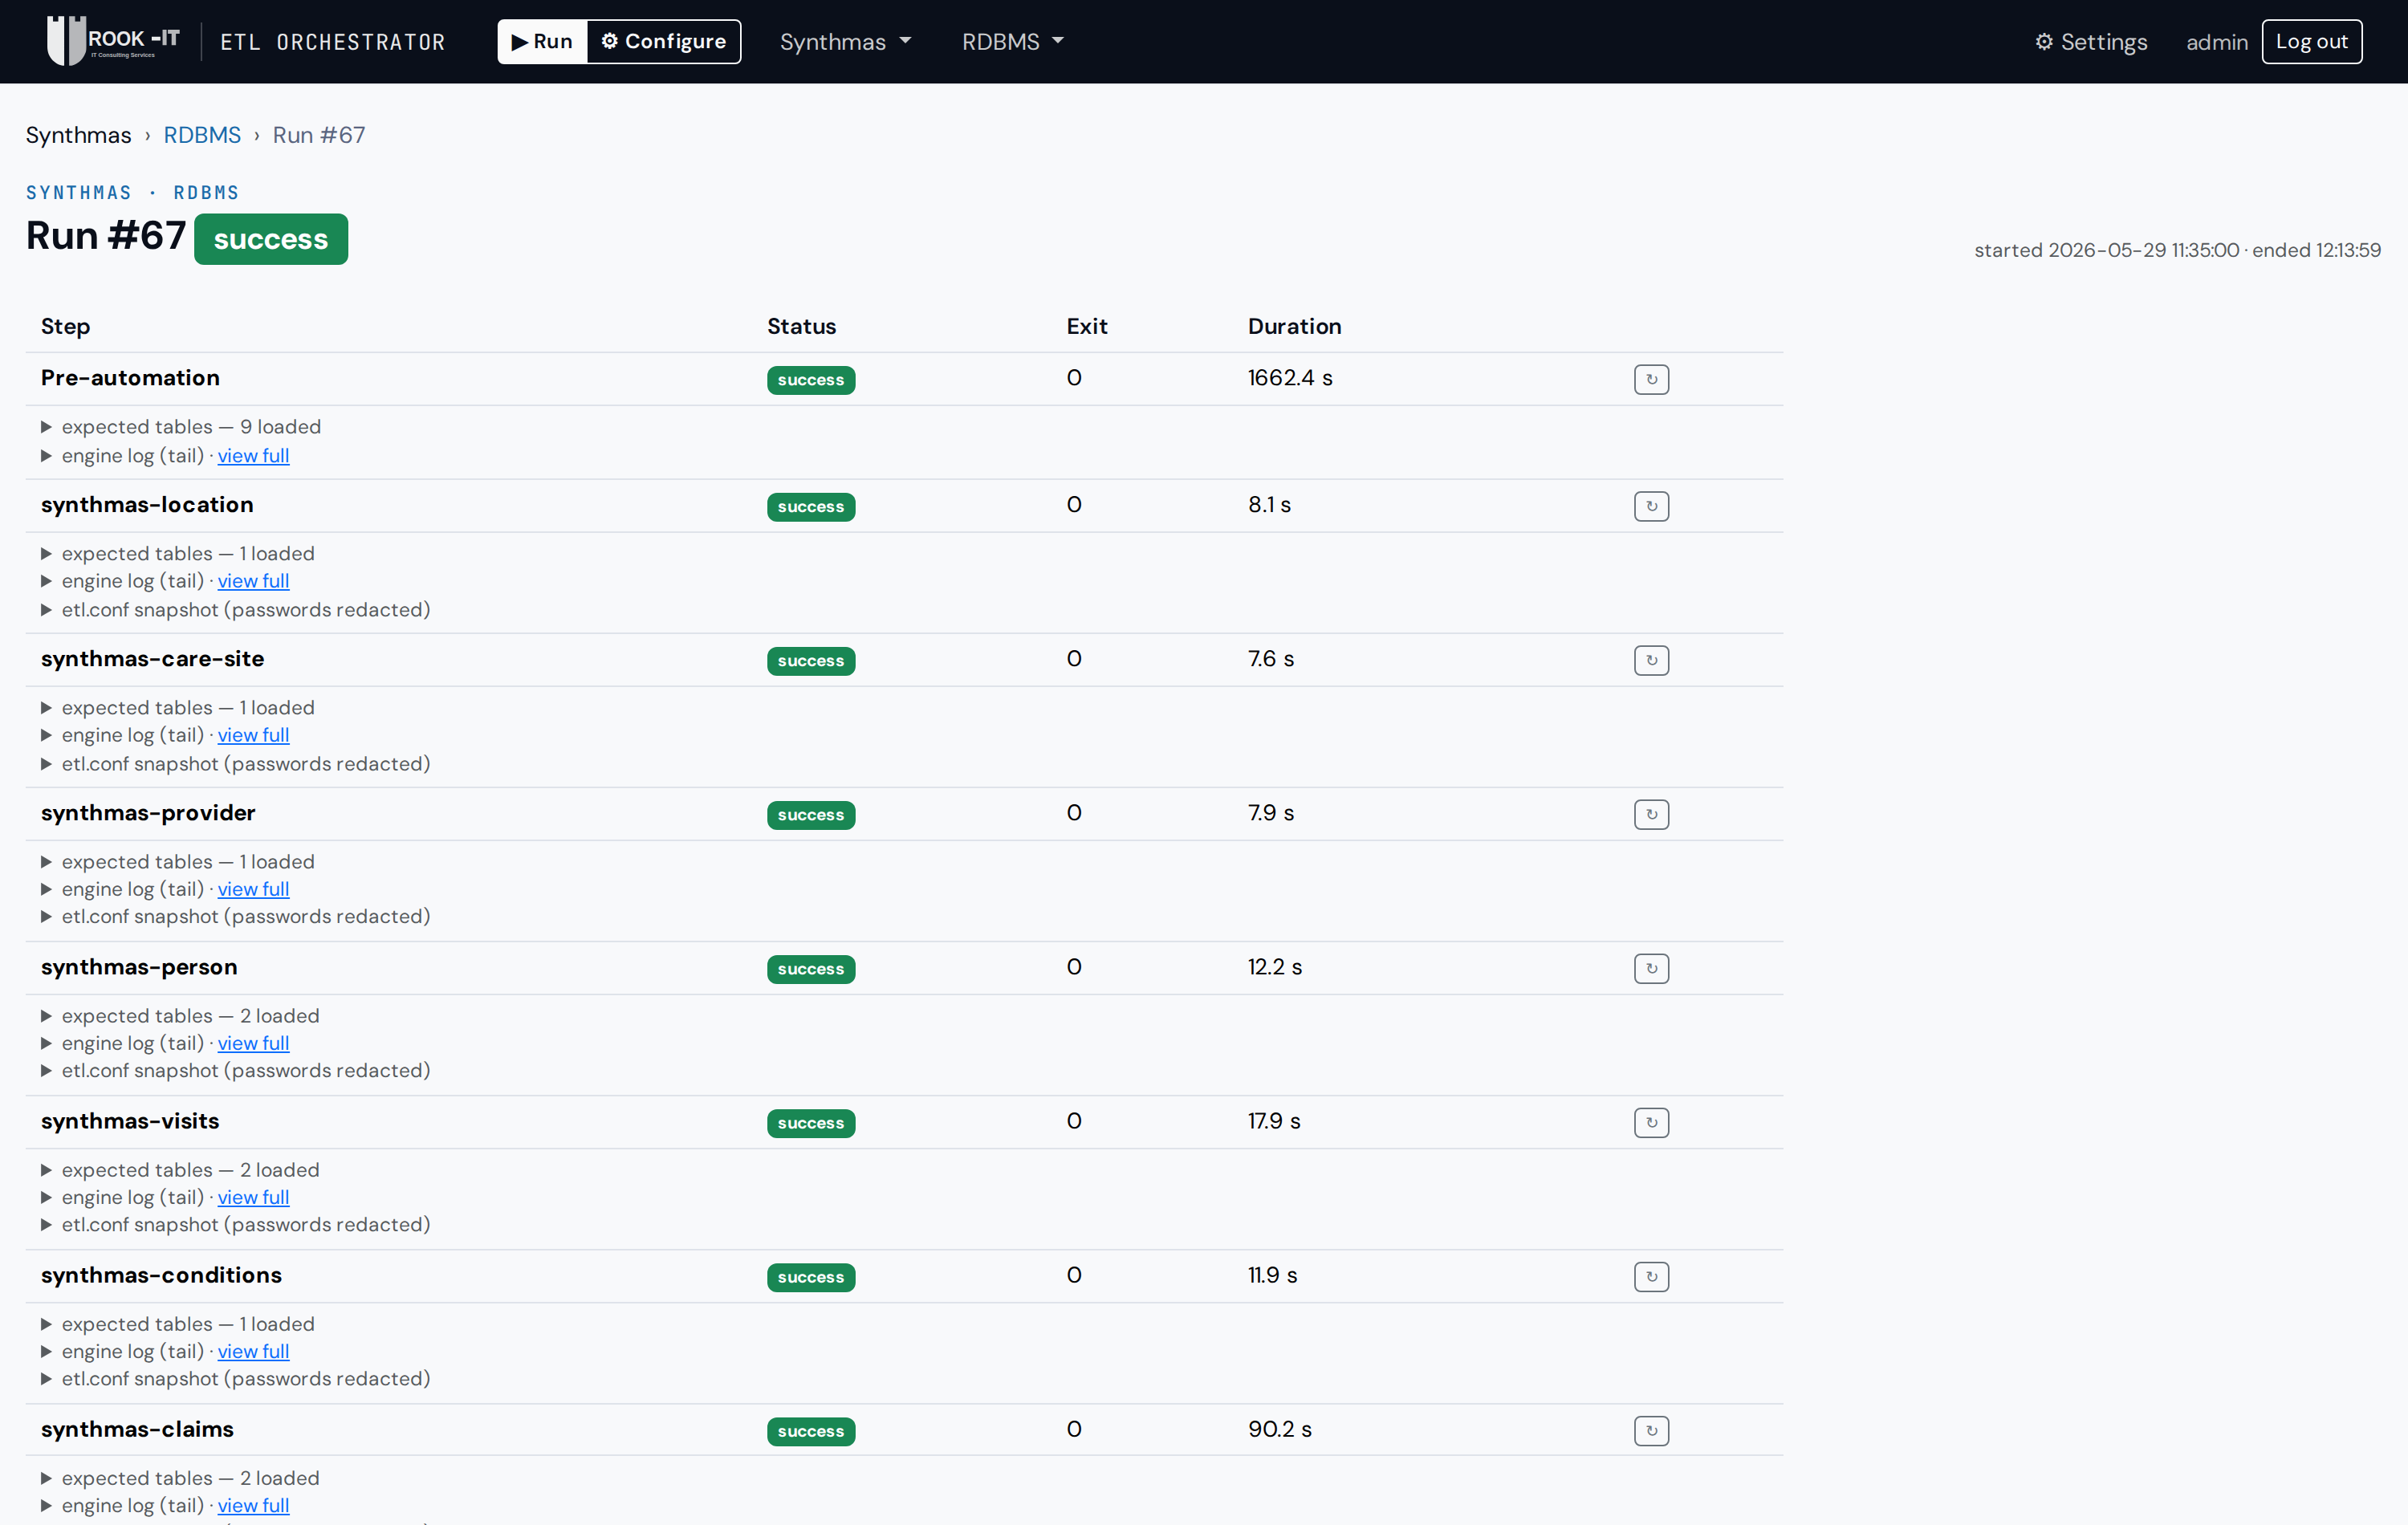
The "Recent runs" table at the bottom of the page also auto-updates — no page reload needed. Each row links to the run-detail page with full per-step outcomes + downloadable engine logs.
Aborting
A 🛑 Stop button appears next to the ribbon while a run is in
flight. Click it → the dispatcher stops scheduling further steps + the
currently-running engine container is killed. The pipeline_run status
turns aborted; partially-loaded data stays in the CDM (the next
re-run's cleanup will handle it).
When a step fails
- The step turns red.
- The run keeps going only for steps that don't depend on the
failed step. Anything downstream of the failure shows up as
blockedwith adep_check_failedreason. - The whole run rolls up to
partial(some steps OK, some not) orfailed(pre-automation died — no point running anything else). - Click the failed step to see the engine log (live-tailed; lets you read the actual exception inline).
After the run
- Run mode → Recent runs lists every run for this env.
- Run detail page (click a run id) gives the full step-by-step
outcome history with per-step engine logs you can download as
.logfiles.